
Data Analysis
employee grinding analysis

Understand the project
Customer attrition, also known as customer churn, is the rate at which a business loses customers over a period of time:
Explanation
Customer attrition can occur when a customer cancels or fails to renew their subscription or contract. It can also happen when a customer leaves due to personal circumstances, such as death, relocation, or health problems.
Impact
Customer attrition can significantly impact a business’s bottom line because it’s a direct loss of revenue. A low attrition rate indicates that a business has effective retention strategies and high customer satisfaction. A high attrition rate can mean that customers are dissatisfied or that a competitor is doing a better job.
Classification
Customer attrition can be classified as voluntary or involuntary, and passive or active:
- Voluntary: When a customer actively decides to leave a business
- Involuntary: When a customer leaves due to an unavoidable issue, such as a failed payment attempt
- Passive: When a customer leaves without engaging with the business
- Active: When a customer reaches out to cancel their subscription
Strategies
To reduce customer attrition, businesses can:
- Detect which customers are about to abandon
- Understand the value of the potential loss of those customers
- Implement personalized retention plans
Language to be used
Python version 3.10.16 and above
Task to be done
Understand Dataset
The dataset contains employee information, potentially for the purpose of analyzing employee attrition. Each employee has multiple attributes, including their age, gender, job role, department, education level, salary information, travel frequency, job satisfaction, performance rating, work-life balance, years at the company and attrition status (whether they left the company or not). This data could be used to identify factors that contribute to employee attrition and to develop strategies to reduce it. If you need to download this dataset in full .csv format, please click me
| Age | Attrition | BusinessTravel | DailyRate | Department | DistanceFromHome | Education | EducationField | EmployeeCount | EmployeeNumber | EnvironmentSatisfaction | Gender | HourlyRate | JobInvolvement | JobLevel | JobRole | JobSatisfaction | MaritalStatus | MonthlyIncome | MonthlyRate | NumCompaniesWorked | Over18 | OverTime | PercentSalaryHike | PerformanceRating | RelationshipSatisfaction | StandardHours | StockOptionLevel | TotalWorkingYears | TrainingTimesLastYear | WorkLifeBalance | YearsAtCompany | YearsInCurrentRole | YearsSinceLastPromotion | YearsWithCurrManager |
|---|---|---|---|---|---|---|---|---|---|---|---|---|---|---|---|---|---|---|---|---|---|---|---|---|---|---|---|---|---|---|---|---|---|---|
| 41 | Yes | Travel_Rarely | 1102 | Sales | 1 | 2 | Life Sciences | 1 | 1 | 2 | Female | 94 | 3 | 2 | Sales Executive | 4 | Single | 5993 | 19479 | 8 | Y | Yes | 11 | 3 | 1 | 80 | 0 | 8 | 0 | 1 | 6 | 4 | 0 | 5 |
| 49 | No | Travel_Frequently | 279 | Research & Development | 8 | 1 | Life Sciences | 1 | 2 | 3 | Male | 61 | 2 | 2 | Research Scientist | 2 | Married | 5130 | 24907 | 1 | Y | No | 23 | 4 | 4 | 80 | 1 | 10 | 3 | 3 | 10 | 7 | 1 | 7 |
| 37 | Yes | Travel_Rarely | 1373 | Research & Development | 2 | 2 | Other | 1 | 4 | 4 | Male | 92 | 2 | 1 | Laboratory Technician | 3 | Single | 2090 | 2396 | 6 | Y | Yes | 15 | 3 | 2 | 80 | 0 | 7 | 3 | 3 | 0 | 0 | 0 | 0 |
| 33 | No | Travel_Frequently | 1392 | Research & Development | 3 | 4 | Life Sciences | 1 | 5 | 4 | Female | 56 | 3 | 1 | Research Scientist | 3 | Married | 2909 | 23159 | 1 | Y | Yes | 11 | 3 | 3 | 80 | 0 | 8 | 3 | 3 | 8 | 7 | 3 | 0 |
| 27 | No | Travel_Rarely | 591 | Research & Development | 2 | 1 | Medical | 1 | 7 | 1 | Male | 40 | 3 | 1 | Laboratory Technician | 2 | Married | 3468 | 16632 | 9 | Y | No | 12 | 3 | 4 | 80 | 1 | 6 | 3 | 3 | 2 | 2 | 2 | 2 |
I. Gender analysis
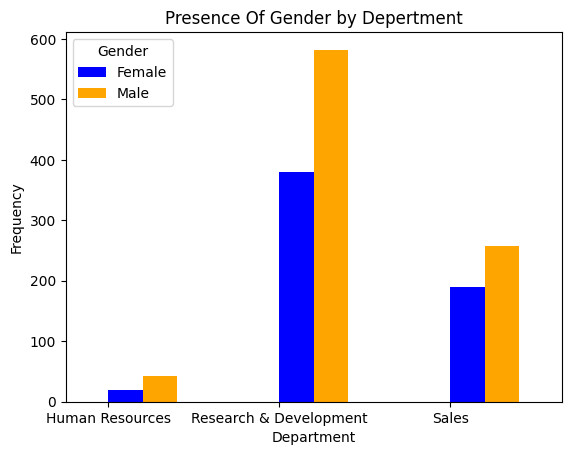
Gender analysis is crucial for understanding how experiences and outcomes differ based on gender. This knowledge can help identify and address gender inequalities within a company or organization. In this phase here is task to do:
II. Analysis by gendaration and education
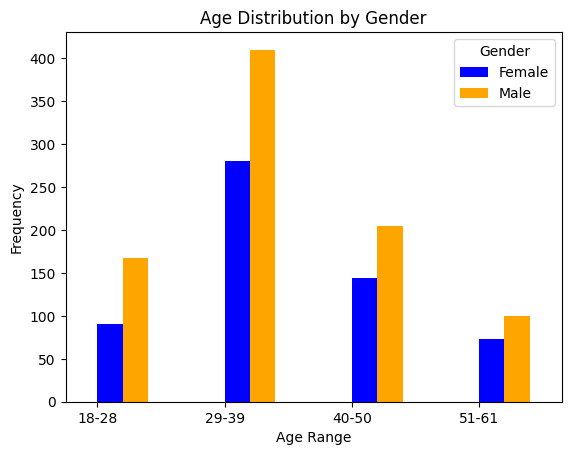
a. Gender Behavior
Analyzing behavior by gender can uncover disparities and trends in how men and women interact with the workplace.
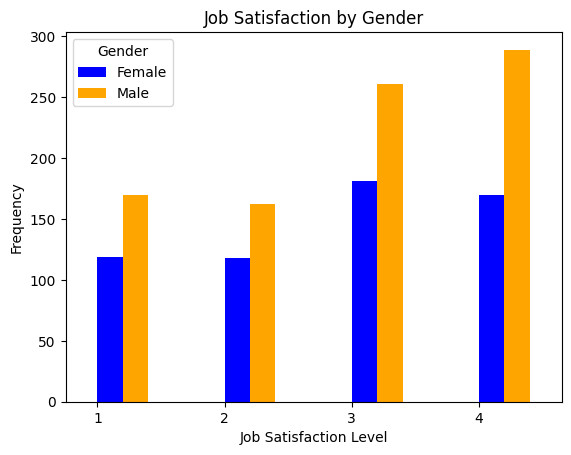
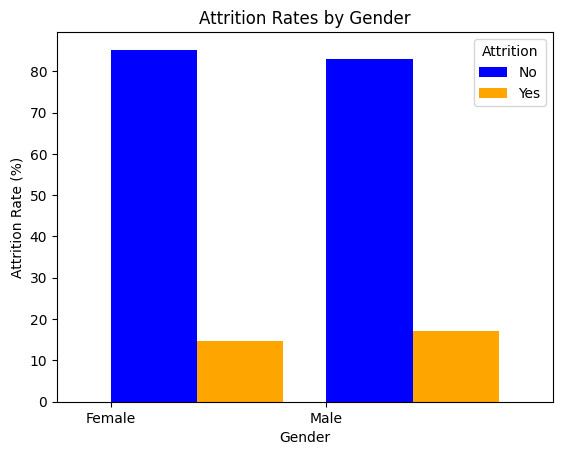
b. Understand Attrition by Gender
Examining attrition rates by gender can reveal if there are gender-specific factors influencing employee turnover. This analysis can help identify and address potential gender inequalities in the workplace.
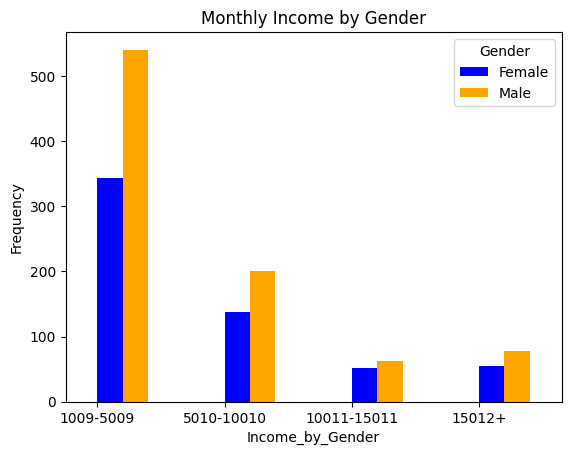
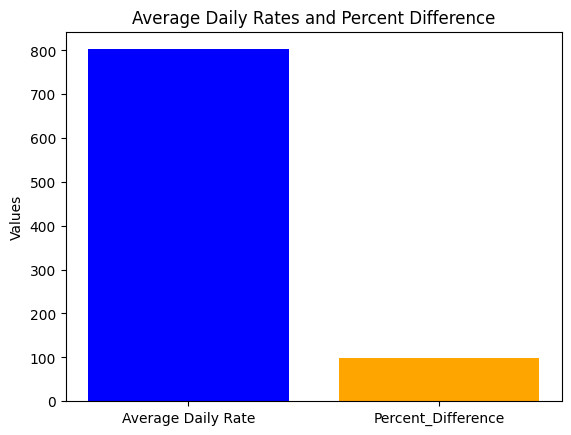
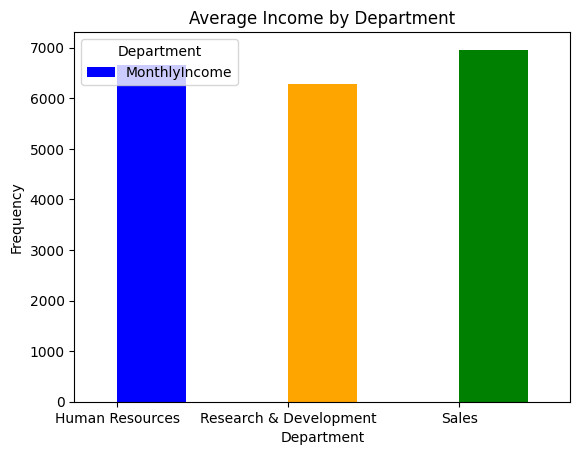
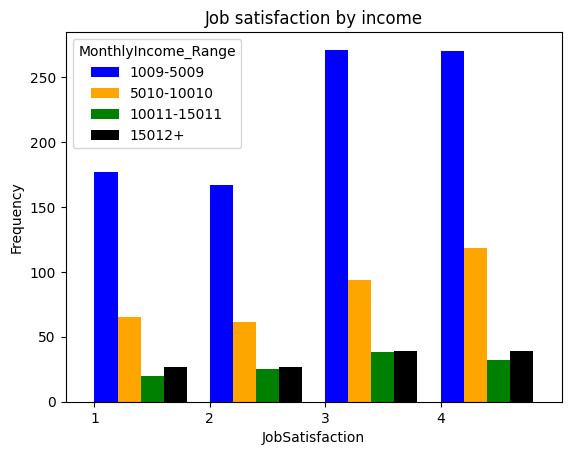
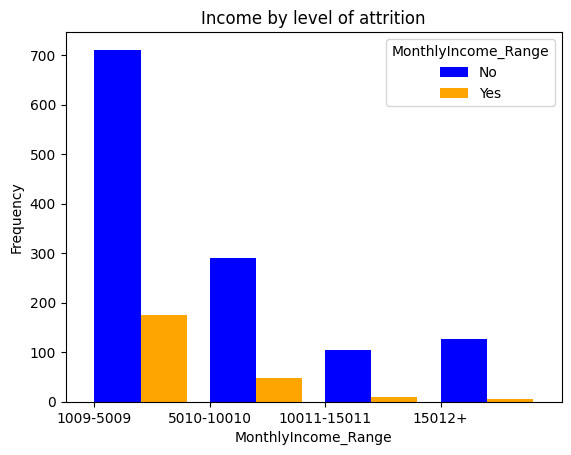
III. The impact of income toword attrition
Income can be a significant factor influencing employee attrition. If employees feel they are not adequately compensated for their work, they may be more likely to seek opportunities elsewhere. in order to understand this here is task to be done:
Iv. Working environment
The following aspects need to be taken into account when understanding the impact of environment to the employee attrition.
these aspects provide a good point for understanding the working environment’s impact on employee attrition. By analyzing these aspects, I can identify potential problem areas and develop targeted interventions to improve employee retention.
V. An in-depth look into attrition
This step is essential for gaining a deeper understanding of the complex factors that contribute to employee attrition. By “digging into attrition” and exploring other potential influencing factors, organizations can develop more targeted and effective strategies to improve employee retention and create a more positive and supportive work environment.
To understand this let break it like this:
VI. Analysis and modules
VII. Conclusion
top reasons why employee leave the organisation