
Data Analysis
Customer Analysis Project
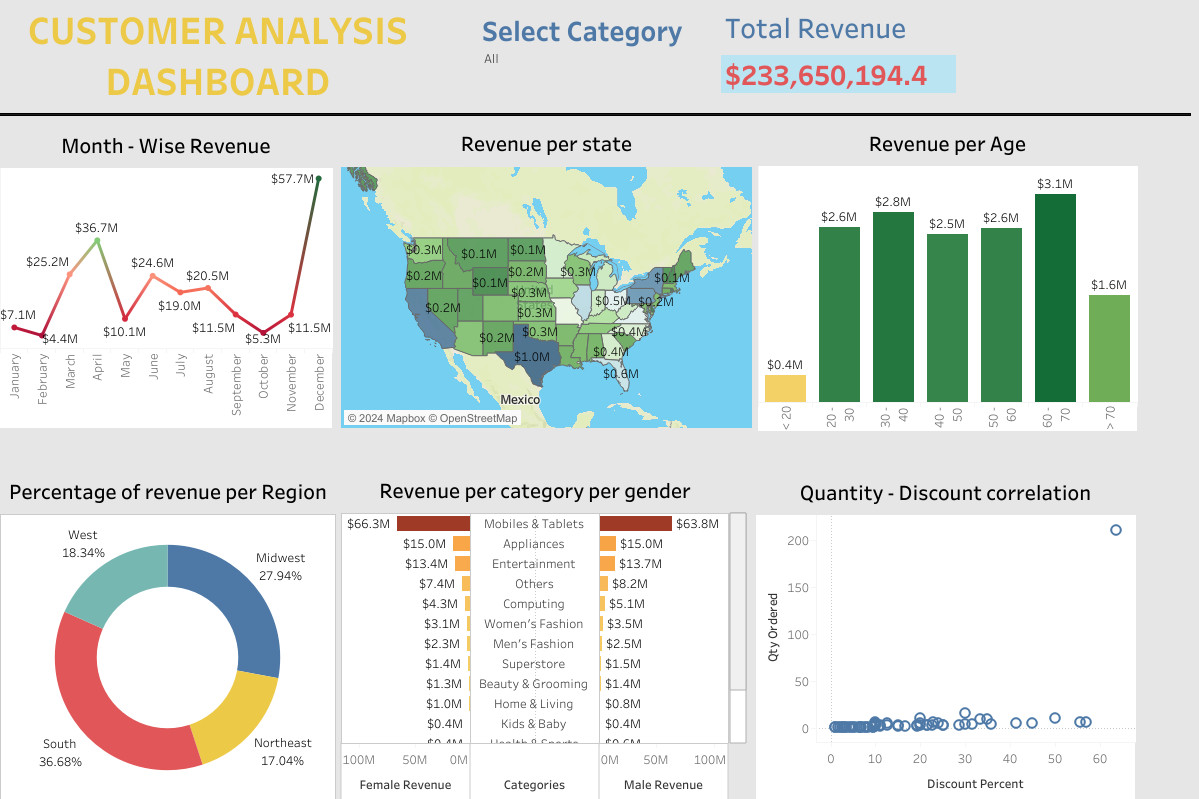
Customer Analysis Project refers to the process of analyzing customer data to uncover valuable insights such as spending patterns, regional performance, and demographic trends. This project involved preparing, analyzing, and visualizing a dataset containing over 26,000 records with key fields like Region, Age group, State, and Sales totals.
Using tools like Tableau Public and Python for data cleaning, the project resulted in an interactive Customer Analysis Dashboard. The dashboard provides:
- Top-performing regions and states based on revenue.
- Age group insights, showing significant contributions from specific customer segments.
- Category-based analysis for identifying high-value customer groups.
By presenting the data in a clear and interactive manner, the project enables stakeholders to make data-driven decisions to improve customer targeting, optimize strategies, and boost revenue growth.
Objective
To analyze customer demographic trends, spending behavior, and regional performance to generate actionable insights for decision-making.
Step 1: Preparing the Data
The provided dataset contained 26,108 rows with the following key columns:
- Region: Geographic region (e.g., Northeast).
- Age bin: Age group ranges (e.g., 40–50, >70).
- Category: Classification of customers.
- State: Specific state names.
- Age: Numerical values for age.
- Total: Sales or revenue figures.
Actions Taken to Prepare the Data:
Data Cleaning:
- Removed duplicates and checked for null values.
- Ensured consistent formatting for text columns (e.g., Region, State).
Data Transformation:
- Grouped data by Region and Age bin to aggregate total revenue.
- Calculated metrics like average sales per age group and regional contributions.
Data Validation:
- Verified totals match expectations and checked for outliers in revenue figures.
Step 2: Analyzing the Data
In this step, the analysis focused on understanding revenue trends, demographics, and relationships within the dataset. The following insights were derived
Month-Wise Revenue
- Revenue trends were analyzed across different months to identify peak performance periods and seasonal patterns.
- This helps businesses plan promotions or inventory management effectively during high-demand months.

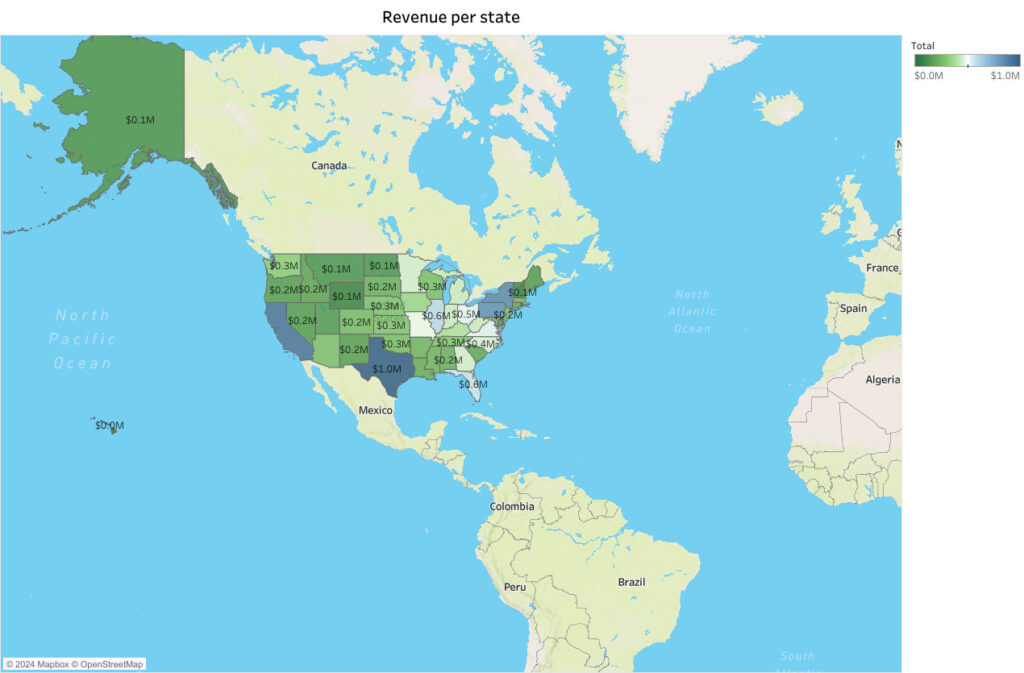
Revenue Per State
- Revenue was aggregated for each State to determine high-performing geographic areas.
- States with consistently high sales can be prioritized for marketing campaigns and resource allocation.
Revenue Per Age
- By grouping customers based on their Age bins, spending patterns were analyzed across age groups.
- This analysis helps target specific age demographics that contribute the most to overall sales.

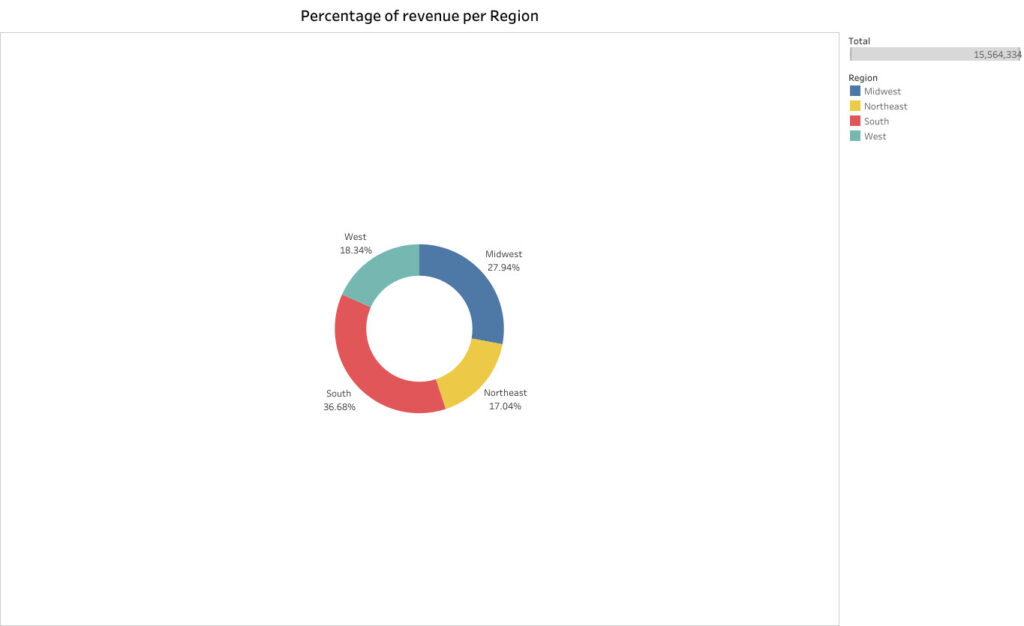
Percentage of Revenue Per Region
- The total revenue was broken down by Region to calculate each region’s contribution as a percentage of overall sales.
- This highlighted the most and least significant regions, providing insights for market focus.
Revenue Per Category Per Gender
- The dataset was further segmented by Category and Gender to analyze spending behavior.
- Identifying trends in gender-based preferences helps in tailoring products or marketing strategies for specific customer segments.

Quantity-Discount Correlation
- A correlation analysis was conducted to identify the relationship between quantity sold and discounts offered.
- Understanding this correlation helps businesses optimize discount strategies to maximize revenue without compromising profitability.

Step 3: Creating the Dashboard
Using Tableau Public, the data was visualized through the following steps:
- Connect Data: Imported the cleaned CSV file into Tableau Public.
- Build Visualizations:
- Bar Charts: Displayed sales totals by Region to highlight top-performing regions.
- Line Graphs: Illustrated trends in revenue across Age bins.
- Heat Map: Showed regional concentration of high-spending customers.
- KPIs: Displayed total revenue, average age group contributions, and state-level performance.
- Design Dashboard: Combined visuals into a single dashboard with filters for Region, Age group, and Category to enhance interactivity.
Features of the Dashboard:
- Interactive Filters: Users can drill down by Region, State, and Age group.
- Tooltips: Provide additional details (e.g., exact revenue figures).
- Clean Layout: Ensures clear, professional presentation of insights.
Step 4: Interpretation of Results
The analysis provided meaningful insights into customer revenue trends, demographics, and regional performance. Key findings include:
Month-Wise Revenue:
- Revenue displayed clear seasonal patterns, with certain months outperforming others. This indicates opportunities to align marketing campaigns or promotions with peak revenue periods.
Revenue Per State:
- Specific states emerged as high performers, contributing significantly to overall revenue. These states can be prioritized for further business expansion or targeted marketing efforts.
Revenue Per Age:
- The analysis revealed that certain age groups (e.g., 30–40 and 40–50) contributed the most to overall revenue. These age groups represent a critical customer base that businesses can focus on for personalized offers.
Percentage of Revenue Per Region:
- Regions such as the Northeast contributed the largest share of revenue, while others showed lower performance. This highlights regions that need targeted strategies to drive growth.
Revenue Per Category Per Gender:
- The segmentation of revenue by Category and Gender identified spending preferences among male and female customers. This insight can be leveraged to tailor marketing and product offerings to specific customer segments.
Quantity-Discount Correlation:
- A positive correlation was observed between quantity sold and discounts offered. This suggests that discounts effectively drive higher sales volumes, but care must be taken to ensure profitability is not compromised.
Here is a functional project
